
Expert in online flights, BudgetAir.co.uk, has published a report that examines the cost of watching football in stadiums throughout the world. They intended to analyse the current cost of watching football in each country and measure the entertainment value that each league provides as international travel specialists. They set out to accomplish this by analysing and comparing current ticket prices, the overall market value of players in each league, the quality of each league, and the average number of goals scored per game in order to provide a comprehensive assessment of the cost of watching football and the entertainment value fans receive in various leagues around the world.
Steffen Boon, Global Marketing Director at Travix, stated “we wanted the study to capture the current ticket market in each country and expose some of the challenges football fans are facing when sourcing tickets during the pandemic… In some leagues, high demand means all official tickets are bought by paying club members, especially for premium matches between the best teams and particularly at the moment, when there is reduced supply due to partial stadium closures in some countries. For visiting tourists wanting to watch a match, this means they must instead use ticket reseller websites where they often encounter vastly inflated prices. The study scoured both official and reseller platforms to provide a stimulating comparison of where it is most expensive and most affordable to watch football in stadiums around the world as well as, crucially, where fans receive the best entertainment value.”
The study was carried out in the following ways: First, the researchers identified domestic leagues that are noteworthy in the world of football. After that, the researchers looked at the prices of tickets for forthcoming games in each league. For this, they first looked for tickets on official club ticket portals, which they then purchased. If these tickets were not available to the general public – for example, if they were only available to paying club members – the researchers next looked for them on ticket reseller websites. This replicates the predicament that a non-club member fan might find themselves in when looking for match tickets on the secondary market.
So that the data collection technique would be consistent from one place to another, the researchers obtained tickets in two different parts of the stadium: behind the goal and along the touchline, selecting samples from the lowest tier of seats in each location. They also made a distinction between’regular games’ and ‘premium games’ (games between the top teams), in order to account for the fact that costs tend to rise for games that are in more demand.
Once they had collected the ticket costs, they calculated an average departure from the dataset median, which they used to compare the cost of tickets in each league, revealing which countries now have the lowest and most costly tickets. According to the findings of this study, experts calculated the current overall market value of players in each league. Afterwards, they calculated an average deviation from the median in order to determine which leagues have the highest-valued players.
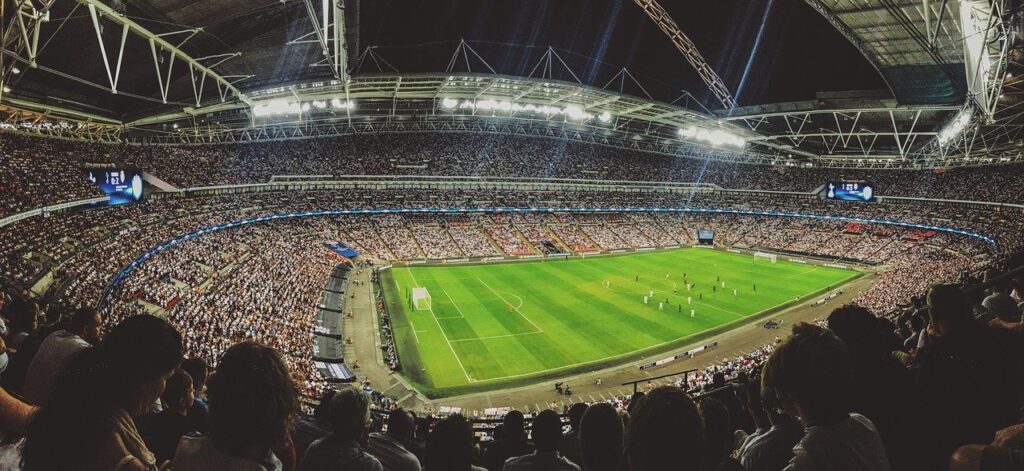
Below is an excerpt from the report
| Country | League | Regular Game – Seat Behind the Goal (€) | Regular Game – Seat Along Touchline (€) | Premium Game – Seat Behind the Goal (€) | Premium Game – Seat Along Touchline (€) | All Tickets – Average Deviation | Market Value of Players – Deviation | Cost vs. Quality Score | Average Goals per Match | Cost per Goal (€) | |
|---|---|---|---|---|---|---|---|---|---|---|---|
| 1 | England | Premier League | 57.21 | 96.33 | 263.03 | 295.27 | 332.90% | 1552.56% | 100.00 | 2.69 | 70.11 |
| 2 | USA | Major League Soccer | 62.96 | 118.48 | 167.01 | 238.72 | 278.29% | 23.73% | 57.23 | 2.84 | 45.13 |
| 3 | Spain | LaLiga | 71.38 | 113.88 | 145.00 | 227.50 | 268.39% | 804.27% | 93.22 | 2.51 | 49.38 |
| 4 | Germany | Bundesliga | 87.75 | 128.25 | 105.00 | 175.00 | 256.30% | 656.10% | 94.61 | 3.03 | 39.13 |
| 5 | France | Ligue 1 | 62.00 | 96.33 | 121.50 | 205.00 | 218.49% | 521.21% | 82.49 | 2.76 | 40.86 |
| 6 | Italy | Serie A | 50.00 | 82.00 | 166.33 | 206.33 | 217.56% | 714.46% | 83.04 | 3.04 | 38.72 |
| 7 | Portugal | Primeira Liga | 60.67 | 73.67 | 143.00 | 200.50 | 209.25% | 126.36% | 74.11 | 2.42 | 45.13 |
| 8 | Netherlands | Eredivisie | 55.00 | 82.50 | 77.25 | 123.75 | 137.66% | 84.40% | 66.82 | 3.01 | 28.15 |
| 9 | Turkey | Süper Lig | 30.04 | 64.25 | 46.88 | 167.92 | 90.53% | 49.05% | 58.63 | 2.70 | 30.80 |
| 10 | Greece | Super League Greece | 12.50 | 30.00 | 95.00 | 210.00 | 85.52% | −19.88% | 1.00 | 2.20 | 39.4 |
Find full report here